
AI Semis: Run-up into year-end likely as macro factors lose potency
The 10-year yield jumped ~15bps yesterday, the 30-year jumped 10bps. The SOX index, down ~1%, hardly took notice. Have rising bond yields lost their potency to depress semi stocks? If so, the recent run-up in SOX could have legs as investors look past rising rates and focus on the fundamentals of high-growth AI stocks.
Macro factors added an additional layer of complexity to AI semi stock response to fundamentals in recent months. Key inflection points in our SOX vs. SPX outperformance metric coincided with turning points in crude oil price and the long bond (Exhibit 1).
Earlier in Q3, even as fundamentals-based investors ascribed falling AI stocks to bearish calls in the media, we think the real culprit may well have been rising bond yields and oil prices. In this context the FOMC decision last week took on extraordinary importance. A rate hike and the prospect of more hikes to come may have mollified bond investors.
The above-normal volatility in semi stocks seen in May-July timeframe has subsided as investors de-risked holdings due to rising crude prices, rising long bond and a steady din of bearish media headlines. All three factors may have lost their potency as volatility got squeezed out. For the past two months, semis have traded in a relatively narrow range.
Case in point – MU’s daily volatility in August has come down to nearly half of what it was in June/July. As we wrote in our MU preview 3 months ago, the stock becomes investible after daily volatility subsides (link). And now it has subsided. In recent days, high beta semis such as SNDK and MU made a break for the upside as daily volatility begins to mean-revert.
We expect a run-up in AI semis into year-end as company management stick to their multi-year optimism and as distractions from extraneous factors give way to investors refocusing on fundamentals. We note that fundamentals remain strong and may have incrementally strengthened in recent months.
–xx–
Are animal spirits returning? In a span of five trading days since the FOMC rate hike, the SOX index outperformed SPX by ~10 percentage points. Have semis has finally escaped the thrall of bearish headlines, rising oil prices and bond yields? They may well have. After months of tossing around the ‘AI is a bubble’ theme, the bears seem to be on the verge of throwing in the towel. A sense of FOMO could descend on the sector as seen in the frenetic action in SNDK, up 20% in 5 days.
SOX – Key inflexion points coincide with pivots in oil and bond yield: Exhibit 1 is a trend chart of SOX outperformance vs. the SPX indexed to Jan 2020.
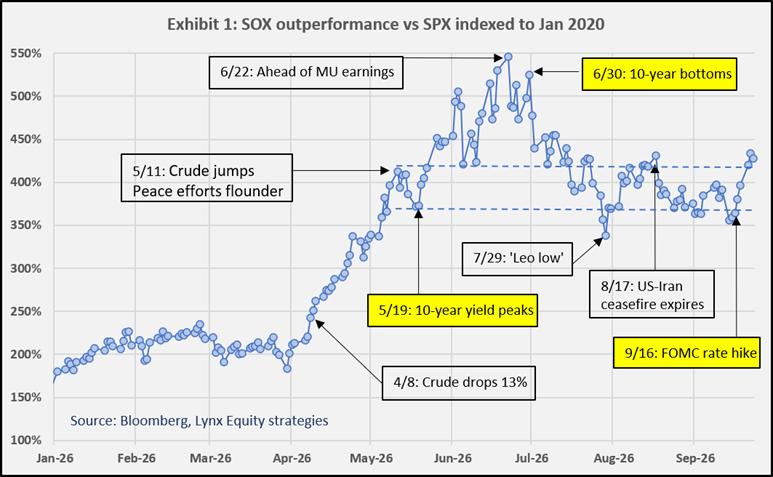
Falling bond yield – Semis uptrend: Our SOX/SPX metric inflected sharply upwards on April 8th coinciding with a sharp drop in crude oil price. The next inflection of metric the happens on May 19th coinciding with the 10-year yield making a local peak (see Exhibit 1). May 19th thru June 30th the SOX/SPX metric rises further. The SOX gains 26% as the 10-year yield drops 29bps
Rising bond yield – Semis downtrend: The SOX/SPX index peaks on June 22nd, heading into MU earnings. The 10-year yield bottoms on June 30th and starts rising. For the next one month thru July 31st, the 10-year yield rises 33bps and the SOX drops 12%. Investor favorite SNDK drops a gut-wrenching 47%.
Rising bond yield – Semis go sideways: After the drop in the July, the daily volatility shrinks and stock settle into a relatively narrow band through August. Semis became less sensitive to movements in oil prices and bond yields. Between August 27th (Jackson Hole event) through September 16th (FOCM event) the 10-year yield rose another 33bps, but the SOX/SPX metric stayed with a narrow range (see Exhibit 1, blue dashed lines). The SOX stay flattish and so do high beta names such as SNDK.
Bond yields stay flattish – Semis uptrend: September 15th through September 22nd, the 10-yr goes sideways as the Fed rate hike on September 16th appeared to stabilize the long bond. With the uncertainty around FOMC now behind, semis investors come off the sidelines. The SOX jumps 12.8% vs. SPX up 2.8%, a 10pp outperformance of the SOX over SPX in a just 4 trading days. Investors appeared anxious to load up on high beta names – SNDK jumped 23% in 4 days. ARM jumped 17% in just one trading day. The catalyst for ARM may well have been the success of the agentic super app Muse from Meta. However, the double digit gain was enabled by a constructive macro environment, in our view.
Semis volatility has come in: The above-normal volatility in semi stocks seen in May-July timeframe has subsided as investors de-risked holdings due to rising crude prices, rising long bond and a steady din of bearish media headlines.
Take Micron for instance. The 7%-8% daily volatility in June/July, delivered a 19% gain in June and a 20% drop in July. In our MU preview 3 months ago, we wrote that the stock would become investable only after the daily volatility settled down. And now it has. Volatility has indeed settled down. The month of August witnessed daily volatility dropping to 3.5%, half of what is was in the preceding three months. During a low volatility month, the MU stealthily climbed 16%. MU now trades only ~10% below its June peak vs. down 30% at the July low.
On the verge of a breakout: In a brief note on September 4th, we pointed out that high beta names such as MU and SNDK were on the verge of a breakout. Since our brief note, MU is u 12% and SNDK 17%
SOX volatility has come in: Exhibit 2 shows the SOX/SPX outperformance metric shown in Exhibit 1 but on a longer time scale. The April thru June rally is indicated by the two red lines. The SOX igained 83%, it outperformed the SPX by 70 percentage points. July thru the present, the volatility in the SOX/SPX metric declined as show by the two dashed lines in Exhibit 2. The two dashed lines converge on the black solid line which falls almost exactly halfway between the two red lines.
Our take: The SOX/SPX metric has worked out the volatility in an orderly manner and is now ready to climb higher (Exhibit 2, black arrow) as volatility mean reverts to the upside.
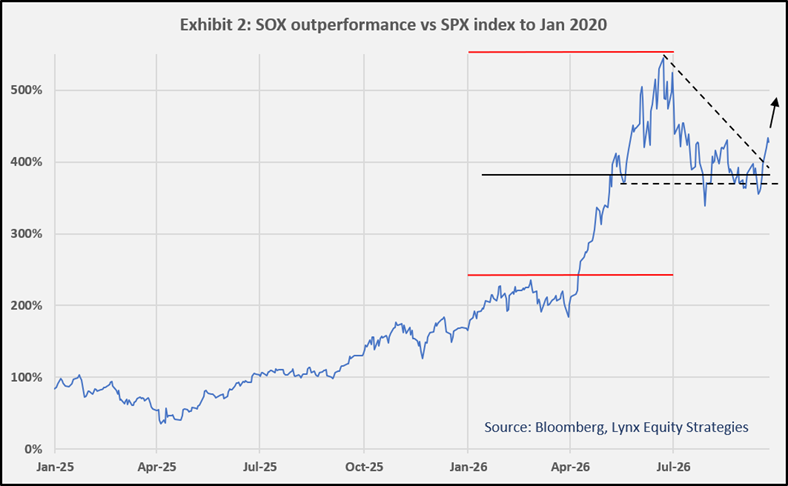
Net/net: Even as fundamentals-based investors ascribed falling AI stocks to bearish calls in the media, we think the real culprit during the July sell-off may well have been rising bond yields and oil prices. Key inflection points in our SOX vs. SPX outperformance metric coincided with turning points in crude oil price and the long bond (Exhibit 1). The above-normal volatility in semi stocks seen in May-July timeframe has subsided as investors de-risked holdings due to rising crude prices, rising long bond and a steady din of bearish media headlines. All three factors may have lost their potency as volatility got squeezed out. For the past two months, semis have traded in a relatively narrow range. The SOX/SPX metric has worked out the volatility in an orderly manner (Exhibit 2) and is now ready to climb higher as volatility mean reverts to the upside.
The 10-year yield jumped ~15bps yesterday, the 30-year jumped 10bps. The SOX hardly took notice. Have rising bond yields lost their potency to depress semi stocks? If so, the recent run-up in SOX could have legs as investors take another look at high-growth, low-multiple AI stocks. A sense of FOMO could descend on the sector as seen in the frenetic action in SNDK, up 20% in 5 trading days.
KC Rajkumar
Disclosures and Disclaimers
Lynx Equity Strategies, LLC is an independent equity research provider. The Company is not a registered broker dealer or investment adviser. No employee or member of the Company, or immediate family member thereof, exercises investment discretion over securities of any issuer analyzed in this report two days prior and/or two days after this report is issued. It participates in “Alpha Capture Systems” that seeks investment or trading ideas from the sell-side and may pay for the participation based on relative performance.
Limitations of Information
This report has been prepared for distribution to only qualified institutional or professional clients of Lynx Equity Strategies, LLC (the “Company”). The contents of this report represent the views, opinions, and analyses of its authors. The information contained herein does not constitute financial, legal, tax or any other advice. All third-party data presented herein were obtained from publicly available sources which are believed to be reliable; however, the Company makes no warranty, express or implied, concerning the accuracy or completeness of such information. In no event shall the Company be responsible or liable for the correctness of, or update to, any such material or for any damage or lost opportunities resulting from use of this data. Nothing contained in this report or any distribution by the Company should be construed as any offer to sell, or any solicitation of an offer to buy, any security or investment. Any material received should not be construed as individualized investment advice. Investment decisions should be made as part of an overall portfolio strategy and you should consult with a professional financial advisor, legal and tax advisor prior to making any investment decision. Lynx Equity Strategies, LLC shall not be liable for any direct or indirect, incidental or consequential loss or damage (including loss of profits, revenue or goodwill) arising from any investment decisions based on information obtained from Lynx Equity Strategies, LLC. Reproduction and Distribution Strictly Prohibited. No user of this report may reproduce, copy, distribute, sell, resell, transmit, transfer, license, assign or publish the report itself or any information contained therein. This report is not intended to be available or distributed for any purpose that would be deemed unlawful or otherwise prohibited by any local, state, national or international laws or regulations or would otherwise subject the Company to registration or regulation of any kind within such jurisdiction.
Copyright, Trademarks, Intellectual Property
Unless otherwise indicated, all copyrights, trademarks, service marks, logos and other intellectual property included in this report are proprietary materials of Lynx Equity Strategies, LLC and the unauthorized use of such terms, marks, and logos is strictly prohibited. The Company reserves all rights with respect to the intellectual property ownership of all materials in this report and will enforce such rights to the full extent permissible by law.